- Get directions
- Leave a review
- Claim listing
- Bookmark
- Share
- Report
- prev
- next
- Tuesday, May 7, 2019 @ 12:20 am
This year’s patent analysis builds on the work presented in the Swiss Biotech Report 2018 and drills deeper into specific biotechnology subsets, including the red (health and medicine), white (industrial) and green (agriculture) biotech categories, as well as established and emerging biotechnology subsets.

Christian Moser
Swiss Federal Institute of Intellectual Property
The biotechnology sector includes a wide array of technologies and applications, and is subject to continuous change, driven by innovation. Patent landscape analyses can visualize these developments from various perspectives, such as technology, geography, or ownership, or combinations thereof.
A quantitative and qualitative comparison of the global biotech patents with those invented in Switzerland reveals the strengths and weaknesses of the Swiss biotech community in the different subsets. With a share of 1.3% of the global biotech patent portfolio accounting for 4% of the global portfolio value, Switzerland is a small but high-quality player in biotech.
A particular strength of Swiss biotech is in the red biotech sector and medicine, and most prominently in the field of antibodies and cytokines. Swiss inventors have been involved in the initial phase of emerging technologies, such as probiotics, CAR cells (cells engineered to display chimeric antigen receptors), or genome editing (i.e. CRISPR/Cas, TALEN, ZNF). Other emerging technology fields such as nanotechnology, digital health, sequencing, or bioinformatics are examples of technology fields which feature a low share of patents invented in Switzerland.
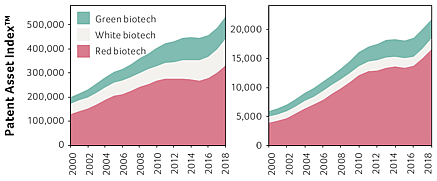
Green, white and red biotech portfolio size from 2000 to 2018
Based on their patent classification, the biotech patents can be categorized in three major application fields: health and medicine (red biotech), industrial (white biotech) and agriculture (green biotech) applications. Biotech patents not assignable to any of the three categories account for less than 3% in both portfolios.

Competitive Impact profiles in 2018
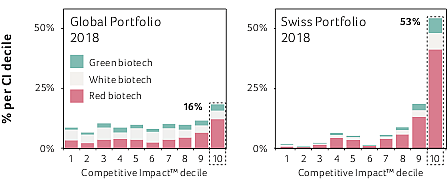
Note: The qualitative parameters Competitive Impact™ for individual patent families and Patent Asset Index™ for the cumulative value of a given portfolio allow for a more differentiated analysis beyond purely quantitative statistics. The biotech patents and the red/white/green biotech subsets were defined exclusively based on the international patent classification (IPC) and corresponding cooperative patent classification (CPC) using the PatentSight platform.
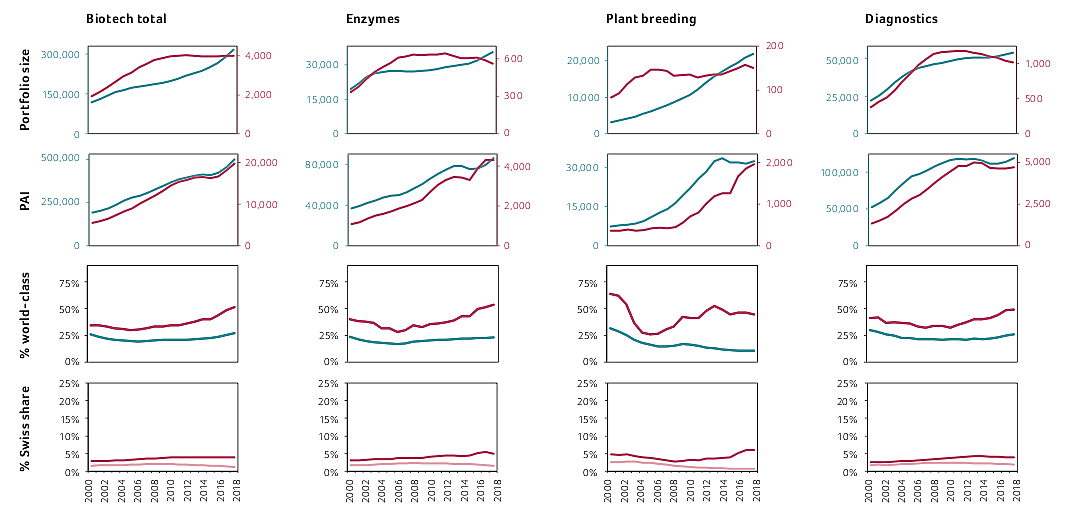
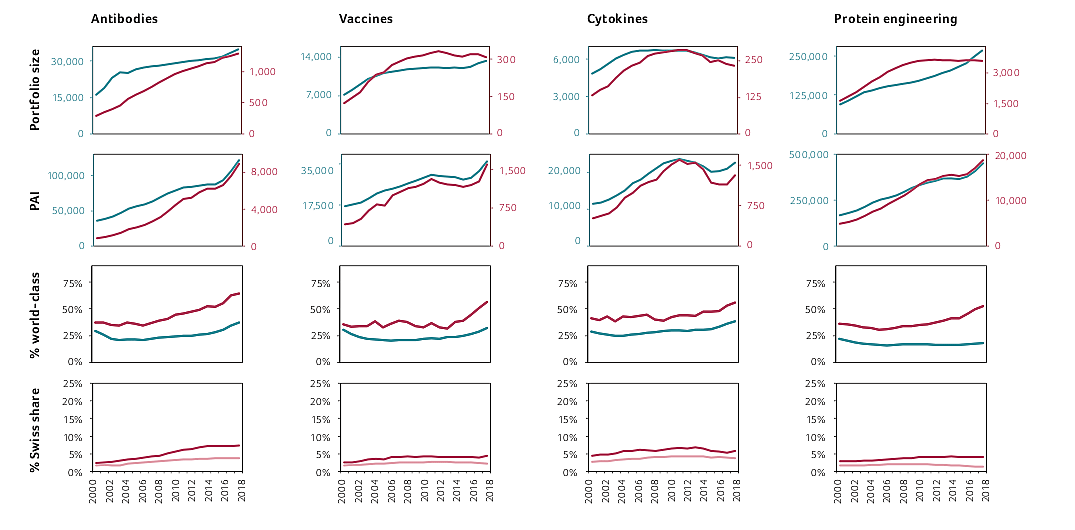
Examples of established biotechnology subsets
Subsets with a substantial patent portfolio size of over 1,000 existing in the year 2000 were defined as ‘established biotech’. As a reference, the graphs on the left represent the entire global biotech portfolio. For each subset, the three top graphs provide the key indicators plotted over the past 18 years, i.e. portfolio size, PAI, and share of ‘world-class patents’ (top CI decile 10), both for the global subsets.
Examples of emerging biotechnology subsets
Emerging technologies are here defined as novel fields within biotechnology, which have evolved from small or non-existent portfolios in the year 2000, often with exceptionally high growth rates. The graphs show the same parameters as displayed in the graphs before.
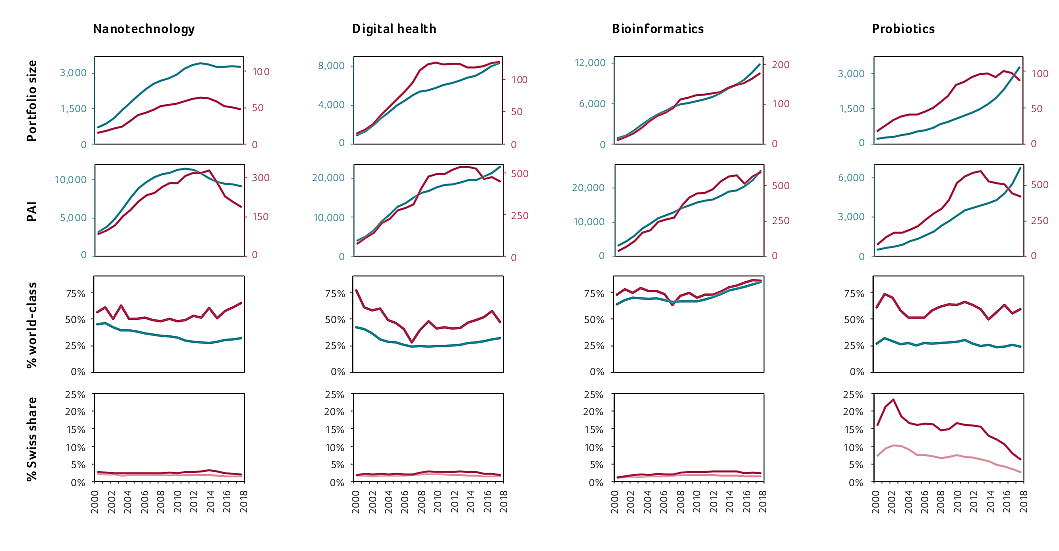
Note: The subsets for emerging technologies were generated by more complex filters including keywords as well as IPC/CPC classification from different databases (Epodoc, WPI, PatentSight), and evaluated with the software PatentSight (www.patentsight.com).
(in petrol green) and for the patents invented in Switzerland (in red). In the two upper graph rows, the left y-axis represents the global portfolio, and the right y-axis refers to the Swiss portfolio. The bottom graph row shows the share of the Swiss patents within the global portfolio, with regard to portfolio size and to PAI.
The Swiss Federal Institute of Intellectual Property is the official government body for intellectual property rights in Switzerland and is responsible for examining, granting and administering these rights. The Institute’s services also include training courses on various aspects of intellectual property and tailor-made searches for trademarks and patent information, including strategic patent analyses involving patent quality parameters. For further information visit www.ige.ch.