- Get directions
- Leave a review
- Claim listing
- Bookmark
- Share
- Report
- prev
- next
- Tuesday, April 20, 2021 @ 10:00 am
Switzerland consistently tops the GII ranking for innovation and is also a leading country of origin for high quality biotech patents. Although the latter only account for a small proportion of Switzerland’s patent portfolio, they are widely regarded as the ‘jewels in the crown’.



Christian Moser, Anna Maria Villa, Patent Experts; Debora Frei, Economist
Swiss Federal Institute of Intellectual Property
High quality patent output helps maintain Switzerland’s top ranking in Global Innovation Index
Switzerland’s top ranking in the Global Innovation Index (GII) over the last ten years results from many different aspects of fostering and implementing innovation. Patents represent only one of many quantifiable parameters of the GII, but the GII ranking and the patent metrics show a remarkable overlap: 15 countries rank among the top 20 in both patent metrics and GII. The overall patent landscape is similar to the 40 times smaller biotech patent landscape. The latter reveals an ongoing race between the leading countries of origin towards higher quality. Denmark and Switzerland are in the lead, closely followed by other European countries and emerging origins of high quality biotech inventions with lower rankings in the GII 2020, such as India or Australia. Switzerland excels in both high patenting activity evident from the GII and excellent patent quality, based on the patent metrics, particularly so in the biotech sector.
Switzerland heads Global Innovation Index for tenth consecutive year
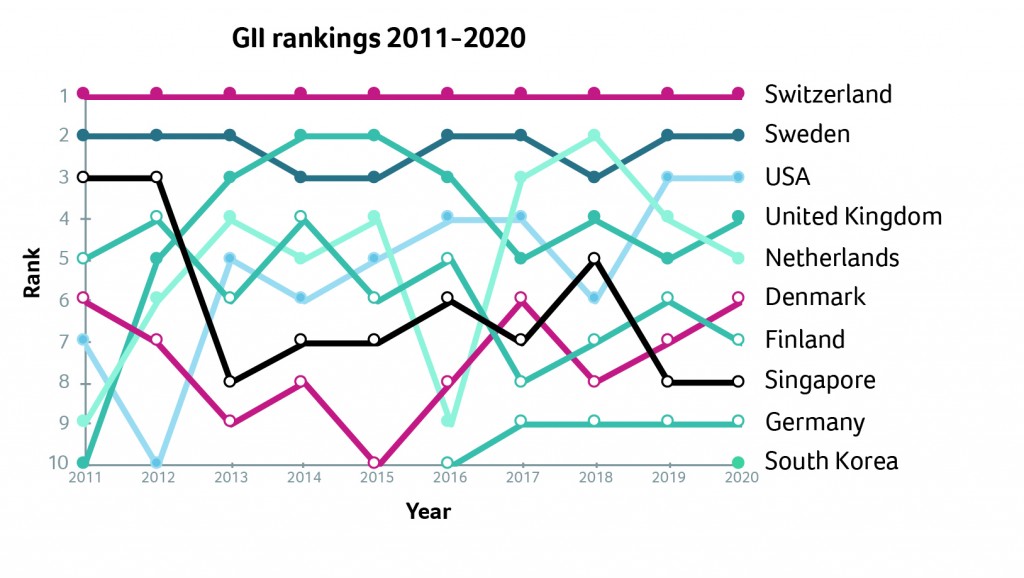
The GII is a ranking of the world’s economies according to innovation capability. The GII 2020 comprises 80 different parameters, which are summarized into two main indices, input and output score. The average of these two indices then forms the overall GII score. Published annually, the GII has evolved into an accepted benchmarking tool for measuring innovation. Since 2011, the GII has continuously ranked Switzerland first (Figure 1). Apart from Switzerland and Sweden, there have been considerable changes in the top 10 rankings over this period. Switzerland’s top place results from high rankings across all 80 parameters.
Figure 1: GII Rankings 2011-2020
Switzerland has consistently ranked nr. 1 since 2011
The GII was initiated in 2007 by Cornell University in collaboration with INSEAD and the World Intellectual Property Organization (WIPO) and covers 131 countries representing 93.5% of the global population and 97.4% of the world’s gross domestic product (GDP).
Both quantity and quality count
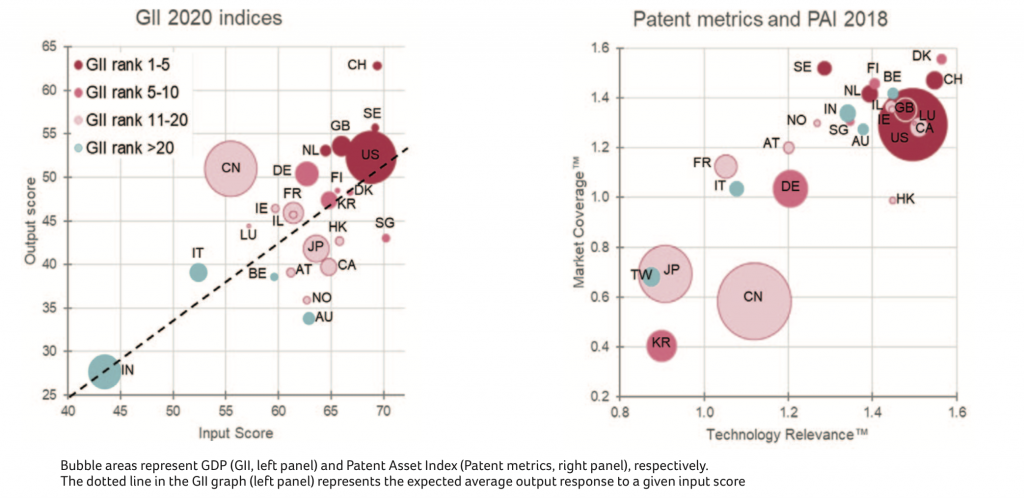
The GII output score (Figure 2, left panel) comprises 27 parameters, including intellectual property rights. While the GII mostly relies on quantitative patent data - i.e. number of national and international applications - the Patent Asset Index (PAI) combines patent quantity and quality, represented by the bubble sizes (Figure 2, right panel). The comparison reveals that 15 of the top 20 GII countries also belong to the top 20 patent inventor countries based on their PAI (Figure 2, right panel). In addition, the top five countries according to GII – Switzerland (CH), Sweden (SE), United States of America (US), United Kingdom (GB), and The Netherlands (NL) - all cluster in the top right quadrant, the high quality sector of the patent landscape.
According to the respective GII 2020 sub-indices, standardized by gross domestic product PPP$ (purchasing power parity) GDP, Switzerland ranks first for number of patents and third for both PCT (Patent Cooperation Treaty) applications and scientific publications.
In contrast, the Patent Asset Index (PAI) metrics include both quantitative and qualitative aspects, regardless of GDP or population. At the end of 2018, the patent portfolio invented in Switzerland ranked 11th with 1.6% of the global portfolio value. In biotech, Switzerland was more prominent, ranking 8th, and accounting for 4% of the global portfolio value.
Figure 2: Global Innovation Index (GII) and Patent metrics
Switzerland and China stand out as the countries significantly exceeding their predicted GII output score (left panel). The top five GII 2020 countries (left panel) also locate in the sweet spot of the Patent Metrics (right panel).
These are Switzerland (CH), Sweden (SE), United States (US), United Kingdom (UK), and the Netherlands (NL).
Because the GII 2020 relies mostly on data from 2018, the patent metrics also show the data of 2018. The Patent Asset Index (PAI) includes all active patent families - i.e. all patent families pending or in force at a given time point, irrespective of their filing year. Similar PAIs can result from small portfolios of high quality, as exemplified by Switzerland (CH), or from larger portfolios of lower average quality such as South Korea (KR). The two countries have similar PAI bubble sizes but are located in opposite sectors of the patent metrics graph.
The patent metrics graph (right panel) allocates the countries’ portfolios based on their average patent quality parameters, i.e. Technology Relevance (x-axis, based on citations of the respective patent as state-of-the-art) and Market Coverage (y-axis, reflecting the GDP-adjusted market size protected by the respective patent family).
A closer look at quality
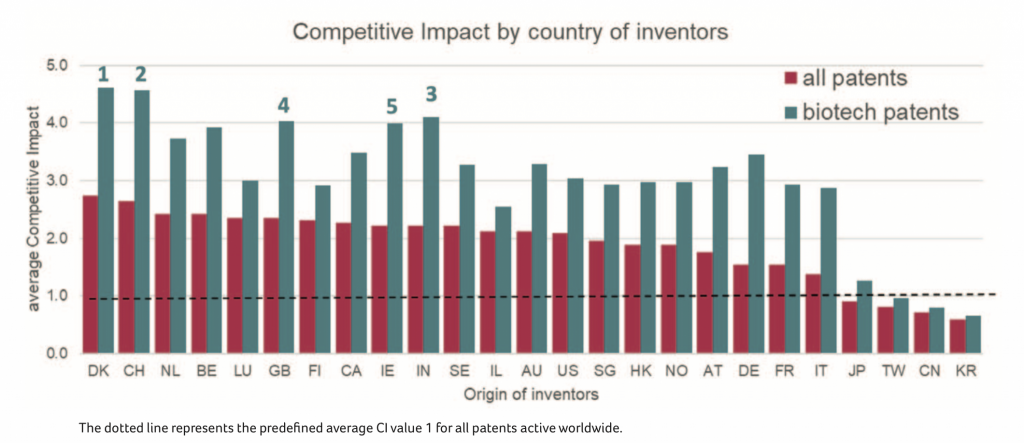
The patent metrics parameter Competitive Impact (CI) focuses on quality only (Figure 3). It represents the average quality index of a given active patent portfolio, independent of the number of patents included therein. Based on the CI, Denmark ranks first, closely followed by Switzerland, both for the entire patent portfolio and for the biotech subset. Without exception, all countries show higher CI values for their biotech patents than for their entire portfolios. The patent metrics do match the GII rankings when it comes to the top ranking countries, but some important countries - such as Belgium, India, or Australia – are not in the top 20 of the GII. Remarkably, given its ranking of 48 in the GII, India ranks third in biotech CI, and 10th in the CI for all patents.
Thus, when focusing on patent quality and on the subset of biotech patents, discrepancies between the GII ranking and patent metrics become visible. Nevertheless, many of the inventor countries with high patent quality indicators still rank high in the GII, despite its reliance on quantitative rather than qualitative patent data.
Figure 3: Competitive Impact by country of inventors:
Denmark and Switzerland rank first, for both biotech and all patents
Competitive Impact (CI) by country of inventors (reporting Dec 2018). The graph shows the same 25 countries (top 20 GII and/or top 20 Patent Asset Index) as depicted in Figure 2. The order from left to right reflects the CI ranking based on all patents. The CI for a given patent family results from multiplication of the values for “Technology Relevance” and “Market Coverage” of the patent family. The “Patent Asset Index” is the sum of the CI values of all patent families included in a given portfolio.
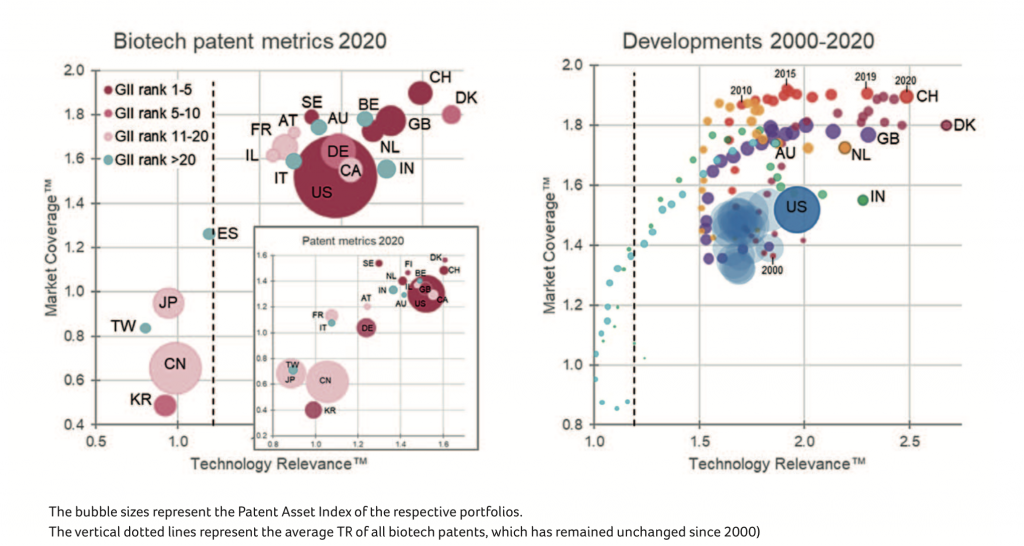
Figure 4: The biotech landscape 2020 and its development since 2000
Since 2010, there is an ongoing race towards higher TR in biotech, with Denmark and Switzerland in the lead
Biotech patent portfolios of the top 20 countries according to Patent Asset Index, status December 2020 (left panel, with inserted graph representing all patents) and development of the biotech portfolios of selected countries over the past 2 decades (right panel) . The bubble trails depict the yearly changes of selected portfolios. The year indicators refer to the Swiss portfolio.
The biotech patent landscape is similar to the overall patent landscape
At the end of 2020, only 2.7% of all 13.2 million active patents qualified as biotech patents, accounting for 4.6% of the total PAI. Nevertheless, the biotech patent landscape is similar to the overall picture. Both landscapes reveal a cluster of European countries alongside India, the USA, Canada, Australia, which combine high Technology Relevance (TR) and high Market Coverage (MC). Again, Denmark and Switzerland are sharing the lead (see Figure 2).
However, the biotech landscape features distinctly higher values on both the TR and MC axes, consistent with the higher average CI of biotech patents shown in Figure 3. Additional information on the biotech patent landscape is available in the online version of this article, including a closer look at the dynamics of the biotech patent landscape over the past 20 years.
The dynamics of the biotech patent landscape over the past 20 years
The development of the biotech portfolios of selected countries over the past 2 decades shows substantial dynamics, illustrated by the bubble trails in figure 4, right panel. From 2000 to 2010, most European countries increased their MC, while the US portfolio gained mostly in volume. Since 2010, all portfolios have kept moving towards higher TR values, with Denmark
and Switzerland in the lead. During the same period, both India and Australia have evolved from inventor countries with tiny biotech portfolios of low quality to important players in the high quality sector.
The ongoing race towards higher TR is limited to the inventor countries in the high patent quality sector, since the TR for all biotech patents has remained at a constant value of 1.2 over the past two decades.
Biotech is providing the jewels in Switzerland’s patent portfolio crown
In summary, Switzerland’s top ranking in the GII is the result of consistently high scores across all 80 parameters considered. Although the impact of patenting activity on the overall GII score of a country is limited, in the case of Switzerland, the high patenting activity combined with excellent quality contributes to the outstanding GII innovation output index.
Biotech patents only account for a small fraction of all patents, with limited impact on the overall portfolio, and an insignificant influence on the GII score of an inventor country. This finding is substantiated by India, Belgium, and Australia, which are important countries of origin for biotech patents, even though they are not ranked among the top 20 in the GII. That said, biotech patents are nevertheless the "jewels in a crown" for many patent portfolios, in particular for countries like Denmark and Switzerland.
COVID-19 disclaimer
The coronavirus pandemic is boosting innovation but most patent applications are not published until 18 months after filing. Thus, analysis of coronavirus-related patenting must wait until complete data is available.
References/further reading
Global Innovation Index 2020: https://www.globalinnovationindex.org
WIPO Intellectual Property Right statistical data: https://www.wipo.int/ipstats/en/
Patent Asset Index metrics by PatentSight: https://www.patentsight.com/patentsight-patent-asset-index
